Summary
This article emphasizes the importance of mortgage marketing reports for refining strategies and improving ROI. It discusses how to track key performance indicators, measure campaign success, and identify areas for improvement. The post provides insights into leveraging data to make informed marketing decisions. By utilizing marketing reports, lenders can achieve more effective campaigns and business growth.
If you don’t know your lap time how will you know if you run the track faster the next time? You can’t improve if you can’t see your results. That’s why we offer 18 different mortgage marketing reports that you can run to gauge how you’re doing. See how many funded loans you’ve got this month compared to last. See a lead source report that will show you where most of your leads are coming from so you can double down on your largest lead sources. Download a lead distribution report to see how many leads each member of your team is getting and how many of those leads they’re closing.
 Here is a quick breakdown of each report offered within BNTouch…
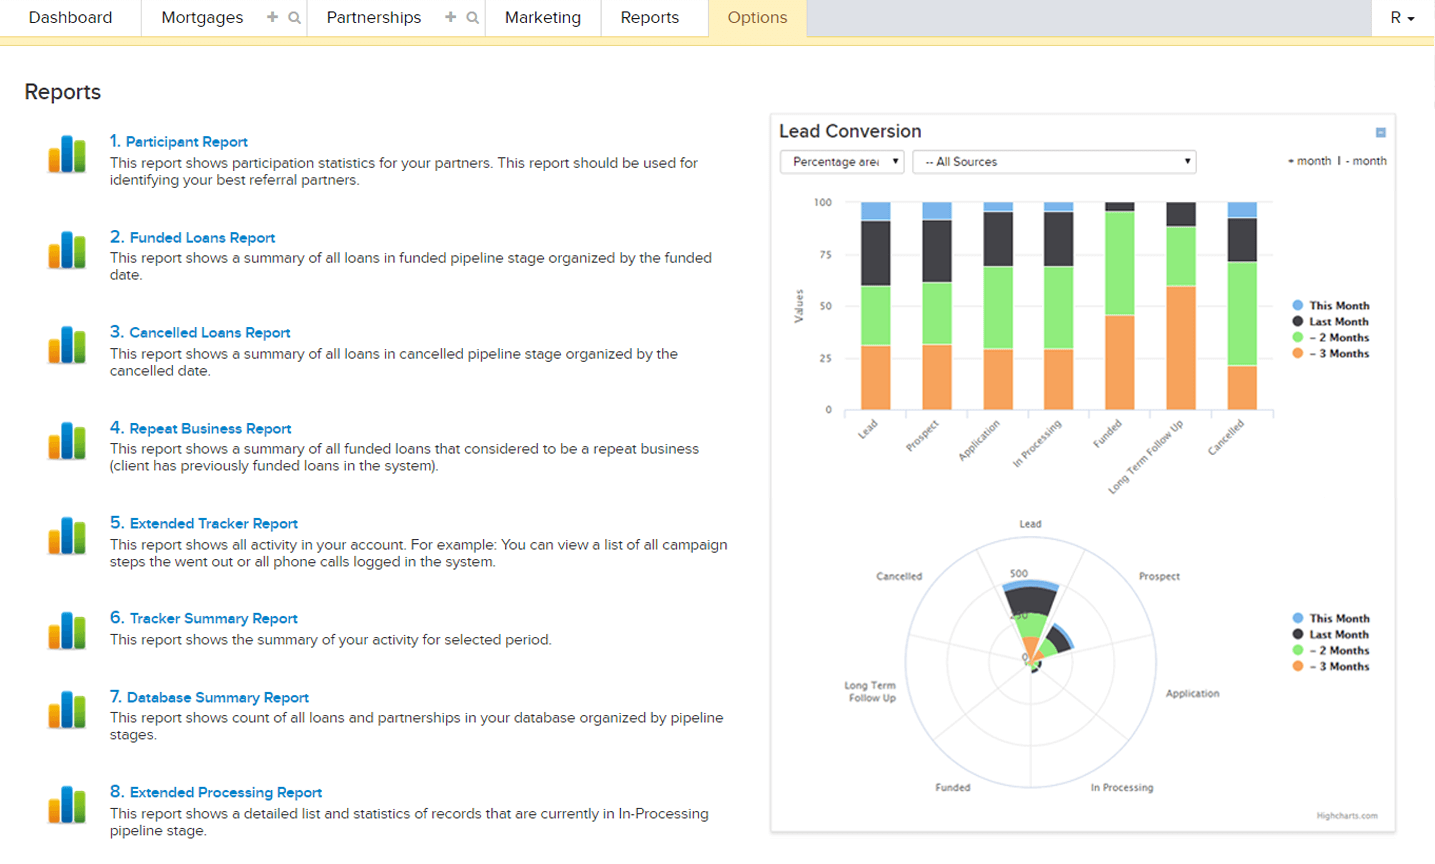
18 Mortgage Marketing Reports
1. Participant Report
This report shows participation statistics for your partners. This report should be used for identifying your best referral partners.
2. Funded Loans Report
This report shows a summary of all loans in funded pipeline stage organized by the funded date.
3. Cancelled Loans Report
This report shows a summary of all loans in cancelled pipeline stage organized by the cancelled date.
4. Repeat Business Report
This report shows a summary of all funded loans that considered to be a repeat business (client has previously funded loans in the system).
5. Extended Tracker Report
This report shows all activity in your account. For example: You can view a list of all campaign steps the went out or all phone calls logged in the system.
6. Tracker Summary Report
This report shows the summary of your activity for selected period.
7. Database Summary Report
This report shows count of all loans and partnerships in your database organized by pipeline stages.
8. Extended Processing Report
This report shows a detailed list and statistics of records that are currently in In-Processing pipeline stage.
9. Marketing Campaigns Activity Report
This report shows how many campaign steps were executed for selected period.
10. Lead Distribution Report
This report will show you how many leads are being assigned to each person in your office per the date range you define. Use the data presented here to track the number of leads you are assigning and improve your ROI by adjusting the maximum number of leads each person in your office can receive each day.
11. Office Performance Report
This report will show you how the number of leads that each person was assigned, the number they accepted and denied, as well as how many campaigns and log updates they make per lead. This report will quickly reveal who is using BNTouch and how active each person is with their new leads.
12. Lead Conversion Report
This report shows how many leads have been received by each lead source and how effective each loan officer at converting those leads from one pipeline stage to another. This report will reveal your top performing lead sources and top performing loan officers.
13. Return On Investment (ROI) Report
This report will show you an estimated return on investment for your lead sources. To use this report, choose your lead sources, choose a field that calculates the sales cost (ie., loan amount), and enter your profit margin (e.g., ##FIELD## * 0.02). This will then calculate all sales, the amount, and multiply them by your margin to give you the return on your marketing dollars.
14. Tasks Report
This report shows a list of pending, completed or all tasks created in selected period.
15. Email Opt-Out and Bounce Report
This report provides you with fast access to the extended statistics for your contacts’ opt-outs and bounces
16. Top Lead Sources Report
This report shows a list of top lead sources for this and last month/year
17. Click-Through Summary Report
This report shows click-throughs statistics for selected period.
18. Lead Source Types Report
Shows month to month statistics for different lead source types.
Key Takeaways
- Track campaign performance for better decisions.
Marketing reports reveal which strategies yield the best ROI.
- Optimize resource allocation.
Reports help identify which efforts deserve more focus or budget.
- Stay proactive with market trends.
Regular reporting ensures you adapt quickly to changes in borrower behavior or demand.
Commonly Asked Questions
- What is the purpose of mortgage marketing reports?
Marketing reports track campaign performance and identify areas for improvement. They provide insights for data-driven decisions.
- What metrics should be included in these reports?
Key metrics include lead generation, conversion rates, ROI, and client engagement. These indicators measure effectiveness.
- How can reports improve future campaigns?
By analyzing past performance, lenders can refine strategies and focus on high-impact tactics. This enhances overall efficiency.
- What tools help generate effective marketing reports?
CRM platforms and analytics tools provide detailed insights and visualizations. These tools simplify reporting and decision-making.
Want To Dive Deeper Into Our Mortgage Marketing Reports?